
Interested in advertising on Derpibooru? Click here for information!

Help fund the $15 daily operational cost of Derpibooru - support us financially!
Description
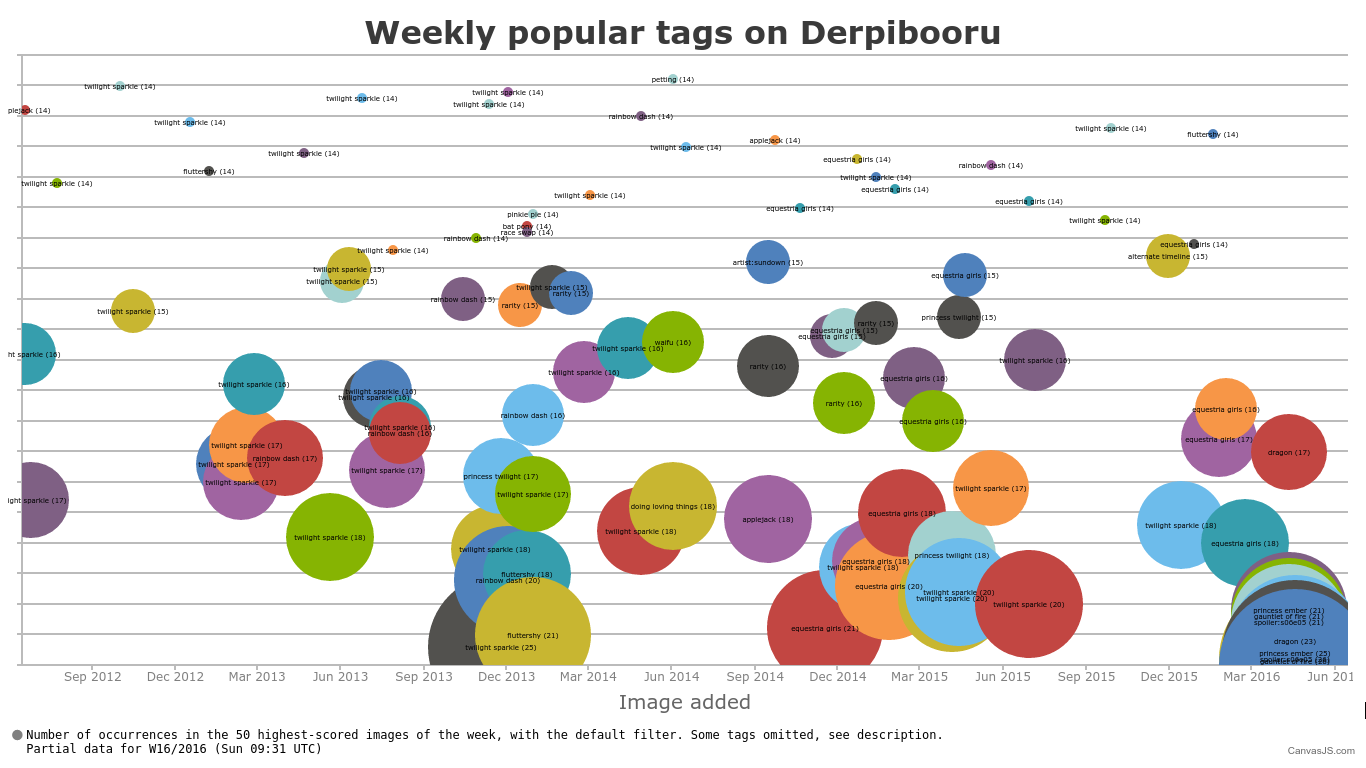
This chart shows the instances in which at least 14 of the 50 highest-scoring images of a week at Derpibooru have had a particular tag, with some omissions. The filter used was the Derpibooru default.
The date range is from 2012-W25 to present, with this week’s (2016-W16) data still being partial – situation Sunday, 09:31 UTC. Week start day is Monday, as per ISO 8601. This means that the weekday during which something “went viral” has a certain effect. However, most spikes are due to new episodes, and since they have always aired on Saturday, the effects are uniform.
The reason for considering only the 50 highest-scoring images of each week is that I’m limited to what I can get out of the API. It allows for a maximum of 50 results at a time.
Some tags are common enough to make it into the top very often. I therefore excluded the tags ‘safe’, ‘suggestive’, ‘solo’, ‘oc’, ‘clothes’, ‘solo female’, ‘blushing’, ‘breasts’, ‘cute’, ‘smiling’, ‘anthro’, ‘looking at you’, ‘belly button’, ‘underwear’, ‘humanized’, ‘panties’, ‘glasses’, ‘open mouth’, ‘cleavage’, ‘animated’ and ‘shipping’. They all have a total of over 9000 images.
There are 14 data points with o=15 and 29 with o=14. Displaying lower occurrence numbers would have made the chart unreadable, as for o=13 the number was 53 and for o=12 it was already 91. Some interesting cut-off data points were ‘socks’ (13, 2016-W05), ‘flutterbat’ (12, 2013-W52 and the same 2013-W53), ‘marble pie’ (12, 2015-W44), ‘maud pie’ (11, 2014-W11; 12, 2014-W12), ‘punklight sparkle’ (11, 2015-W16) and ‘applebucking thighs’ (11, 2014-W38).
I think it is not an exaggeration to describe the recent surge in Ember images as “unprecedented”. There were 21 images the week of airing and 25 this week; ‘twilight sparkle’ had 18 the week of airing of Princess Twilight Sparkle and 25 the following; ‘fluttershy’ had 18 the week of airing of Bats! and 21 the week following. And one must keep in mind that those tags have a “base level”, while Ember is the only non-mane six character to even make the chart.
Source
not provided yet
See >>1139236
I know, im talking about the past, Im surprised Rarity didn’t get a lot of high scoring in September and that Dash didn’t after the finale, and noting that after some point in 2014 it became even MORE heavily Twilight.
@Background Pony #6E57
Fluttershy actually only looks to be there 4 times to me, Dash is really frequent early on but then kind of drops off and the only constant becomes Twilight. It looks like in 2015-2016 there’s only 3 data points where a Mane 6 pony that ISN’T Twilight gets up there (Rarity, Fluttershy and Rainbow Dash, each once)
I am apparently pretty alone in being meh on Twilight, or maybe the fact that she just gets more art gives her more chances to get more popular art.
Right now it’s all about Dragon Waifu.
It’s Twilight. Of course she’s all over the charts. She loves charts :P
>>1010579p (deleted)
y is just the ordinal number of the data point. Not exactly scientific, I know, but I just threw together something where the bubbles don’t overlap horribly.
Hard to compete with nerdy cute and shy cute and pretty brash. :P
… 3 rarity, 2 AJ, and a single Pinkie Pie.
Huh.